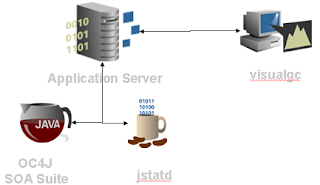
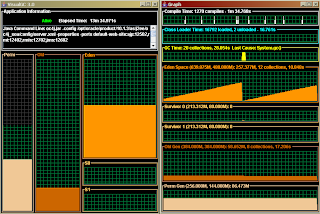
It works as follows. On the application server a daemon program must be run. This program is collecting information from the running JVM's. Via a visual tool, supplied with JVMStat, the behavior of the JVM is shown in a graphical way.
We assume that the JVMStat daemon is running on your application server, on which SOA Suite 10.1.3 is running, and the JVMStat visual tool running from your workstation. This is shown in the following diagram.

Download JVMStat from the the Sun website, unzip the file into a directory on your workstation and copy the zip file to your server and unzip it there as well.
Create a policy file on the server. This file is needed to set the appropriate rights for JMVStat. Create a file named "jstatd.policy". The content of the file must be:
grant codebase "file:$ORACLE_HOME/jdk/lib/tools.jar"
{
permission java.security.AllPermission;
};
Replace $ORACLE_HOME with the full directory path.
On the server you can start the daemon process.
jstatd -J-Djava.security.policy=jstatd.policy
Note that the daemon process is using the policy file, we just created.
Now you can start the visual user interface. This is done by starting the program 'visualgc.cmd' on the workstation. Therefore you must known the process-id of the JVM on which the SOA Suite is running. Use, assuming you run a unix environment, the 'ps -ef | grep java' command to found the process id.
Start the visual tool as follows:
visualgc.cmd
For example:
visualgc.cmd 3219@linuxmachine.local.site
